Observability
contract.dev
An observability platform for smart contracts. Watch what your contracts are doing in production, get alerted when one moves outside expected conditions, and drill from a month-long trend down to the single call behind it. Stagenets replay mainnet state, so a change can be rehearsed before it ships.
Year2025 – Present
TimelineOngoing
RoleLead Frontend Engineer
Overview
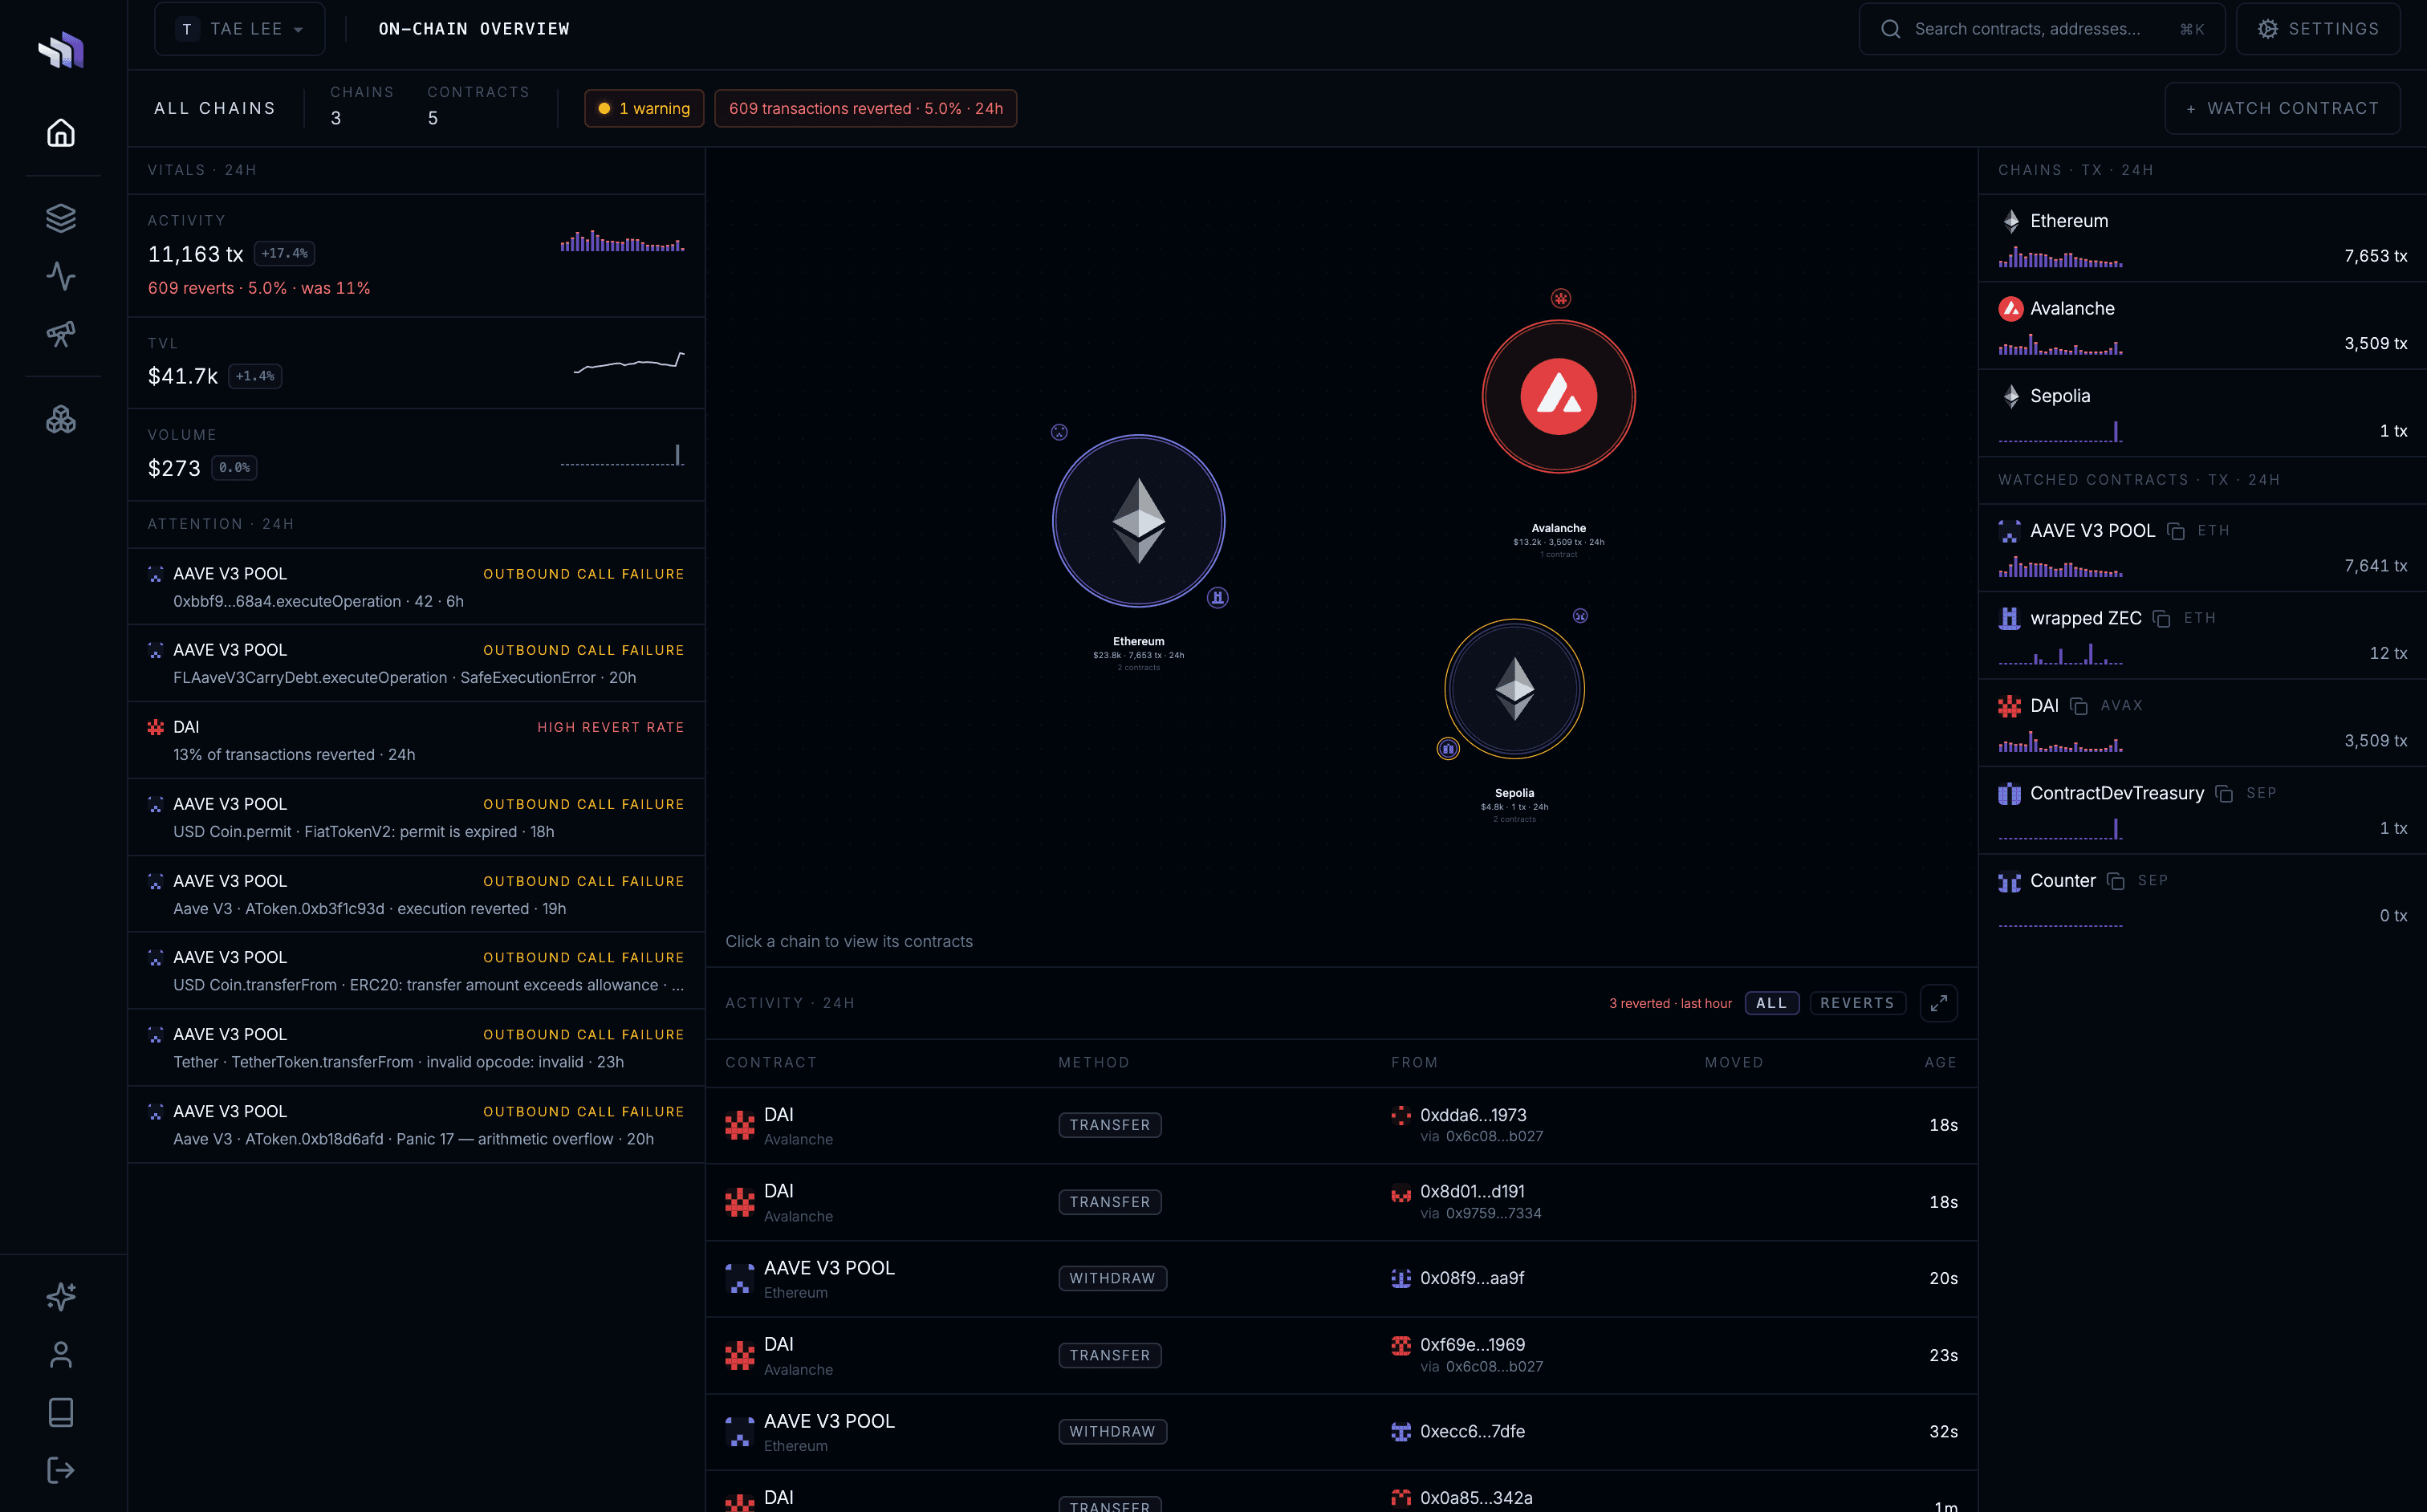
Overview is a map of watched contracts at three scopes: all chains, one chain, or one contract. All chains is one node per chain, with the value held on it. Select a node to zoom in. On a chain, the nodes are the watched contracts, sized by value held, and the links are value transferred over the selected range. The rails show transactions, volume, TVL and open alerts for the current scope. Activity for that scope runs under the map.
Watching runs on Ethereum, Arbitrum, Avalanche and Sepolia. Any EVM chain can be added — which ones are live is a question of demand and running cost, not architecture.
Contracts
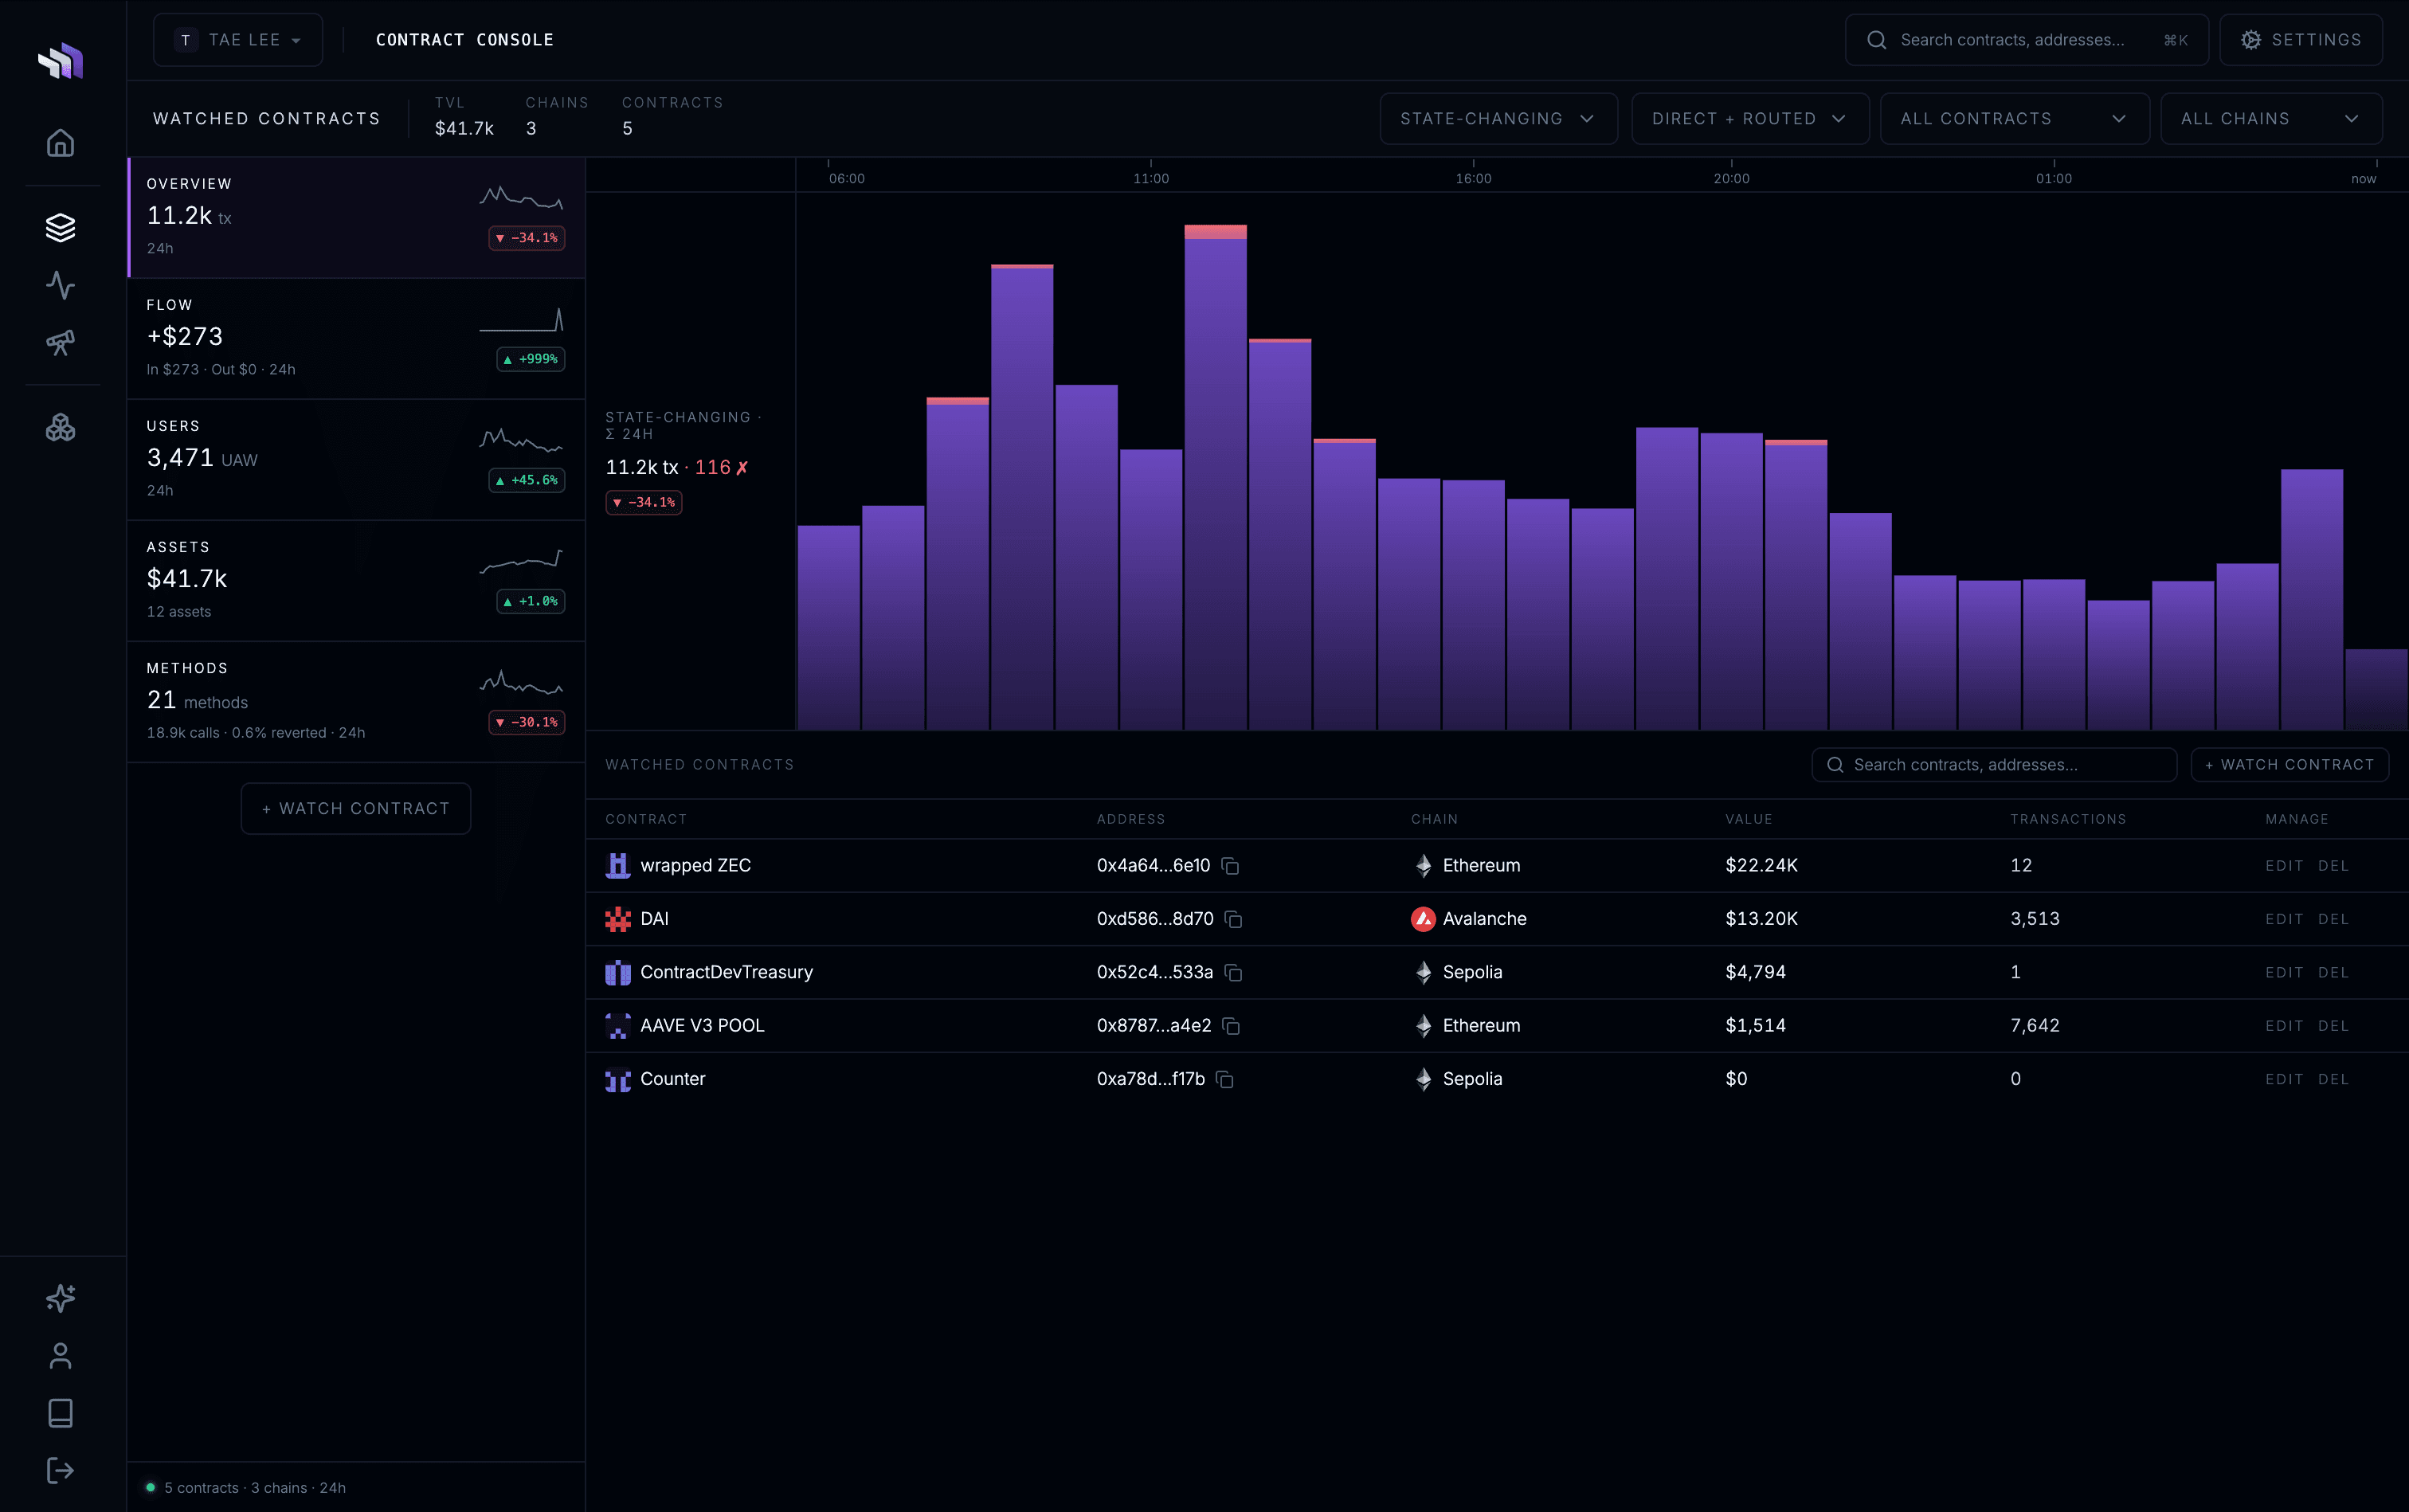
The Contracts console is the dashboards for every watched contract, or for one contract when you select its row. Range, chain and contract are the scope, stored in the URL. There are five views: Overview, Flow, Users, Assets, Methods.
Overview charts transactions, transfer volume and TVL, with the change against the previous window. Transactions can be split by call type (state-changing, all, or reads) and by route (direct, or through another contract). The register under the chart lists each watched contract for that range.
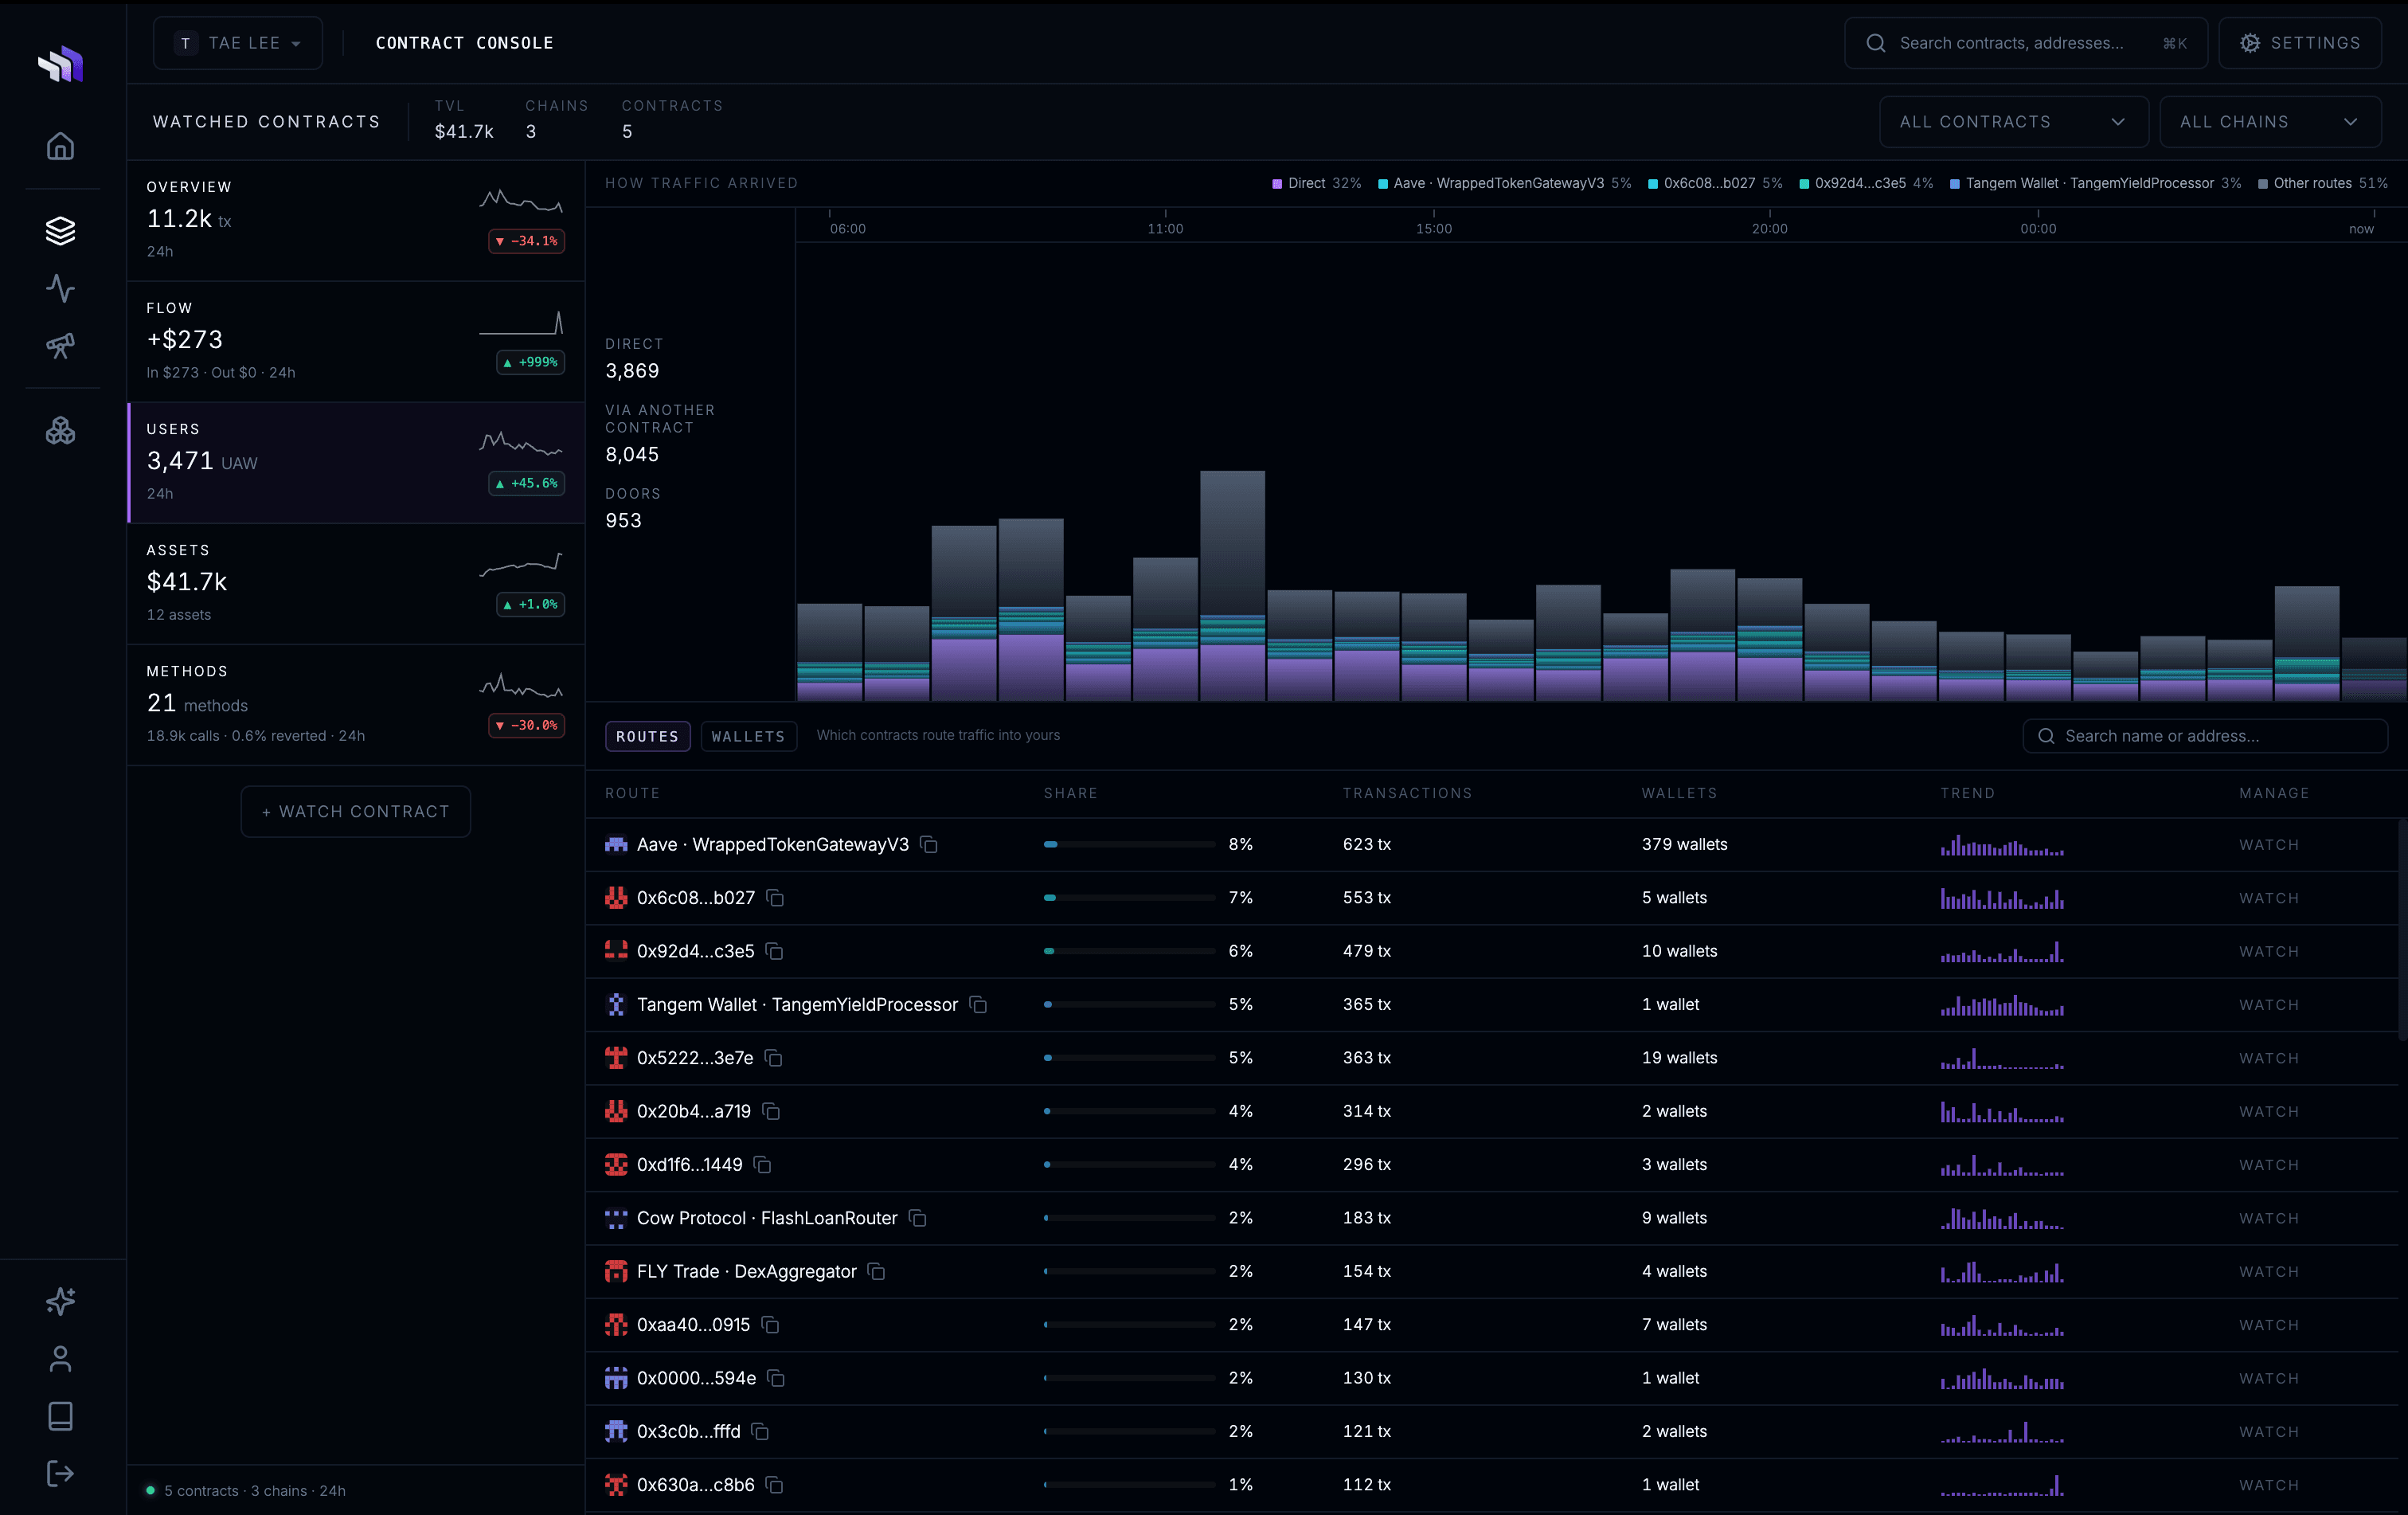
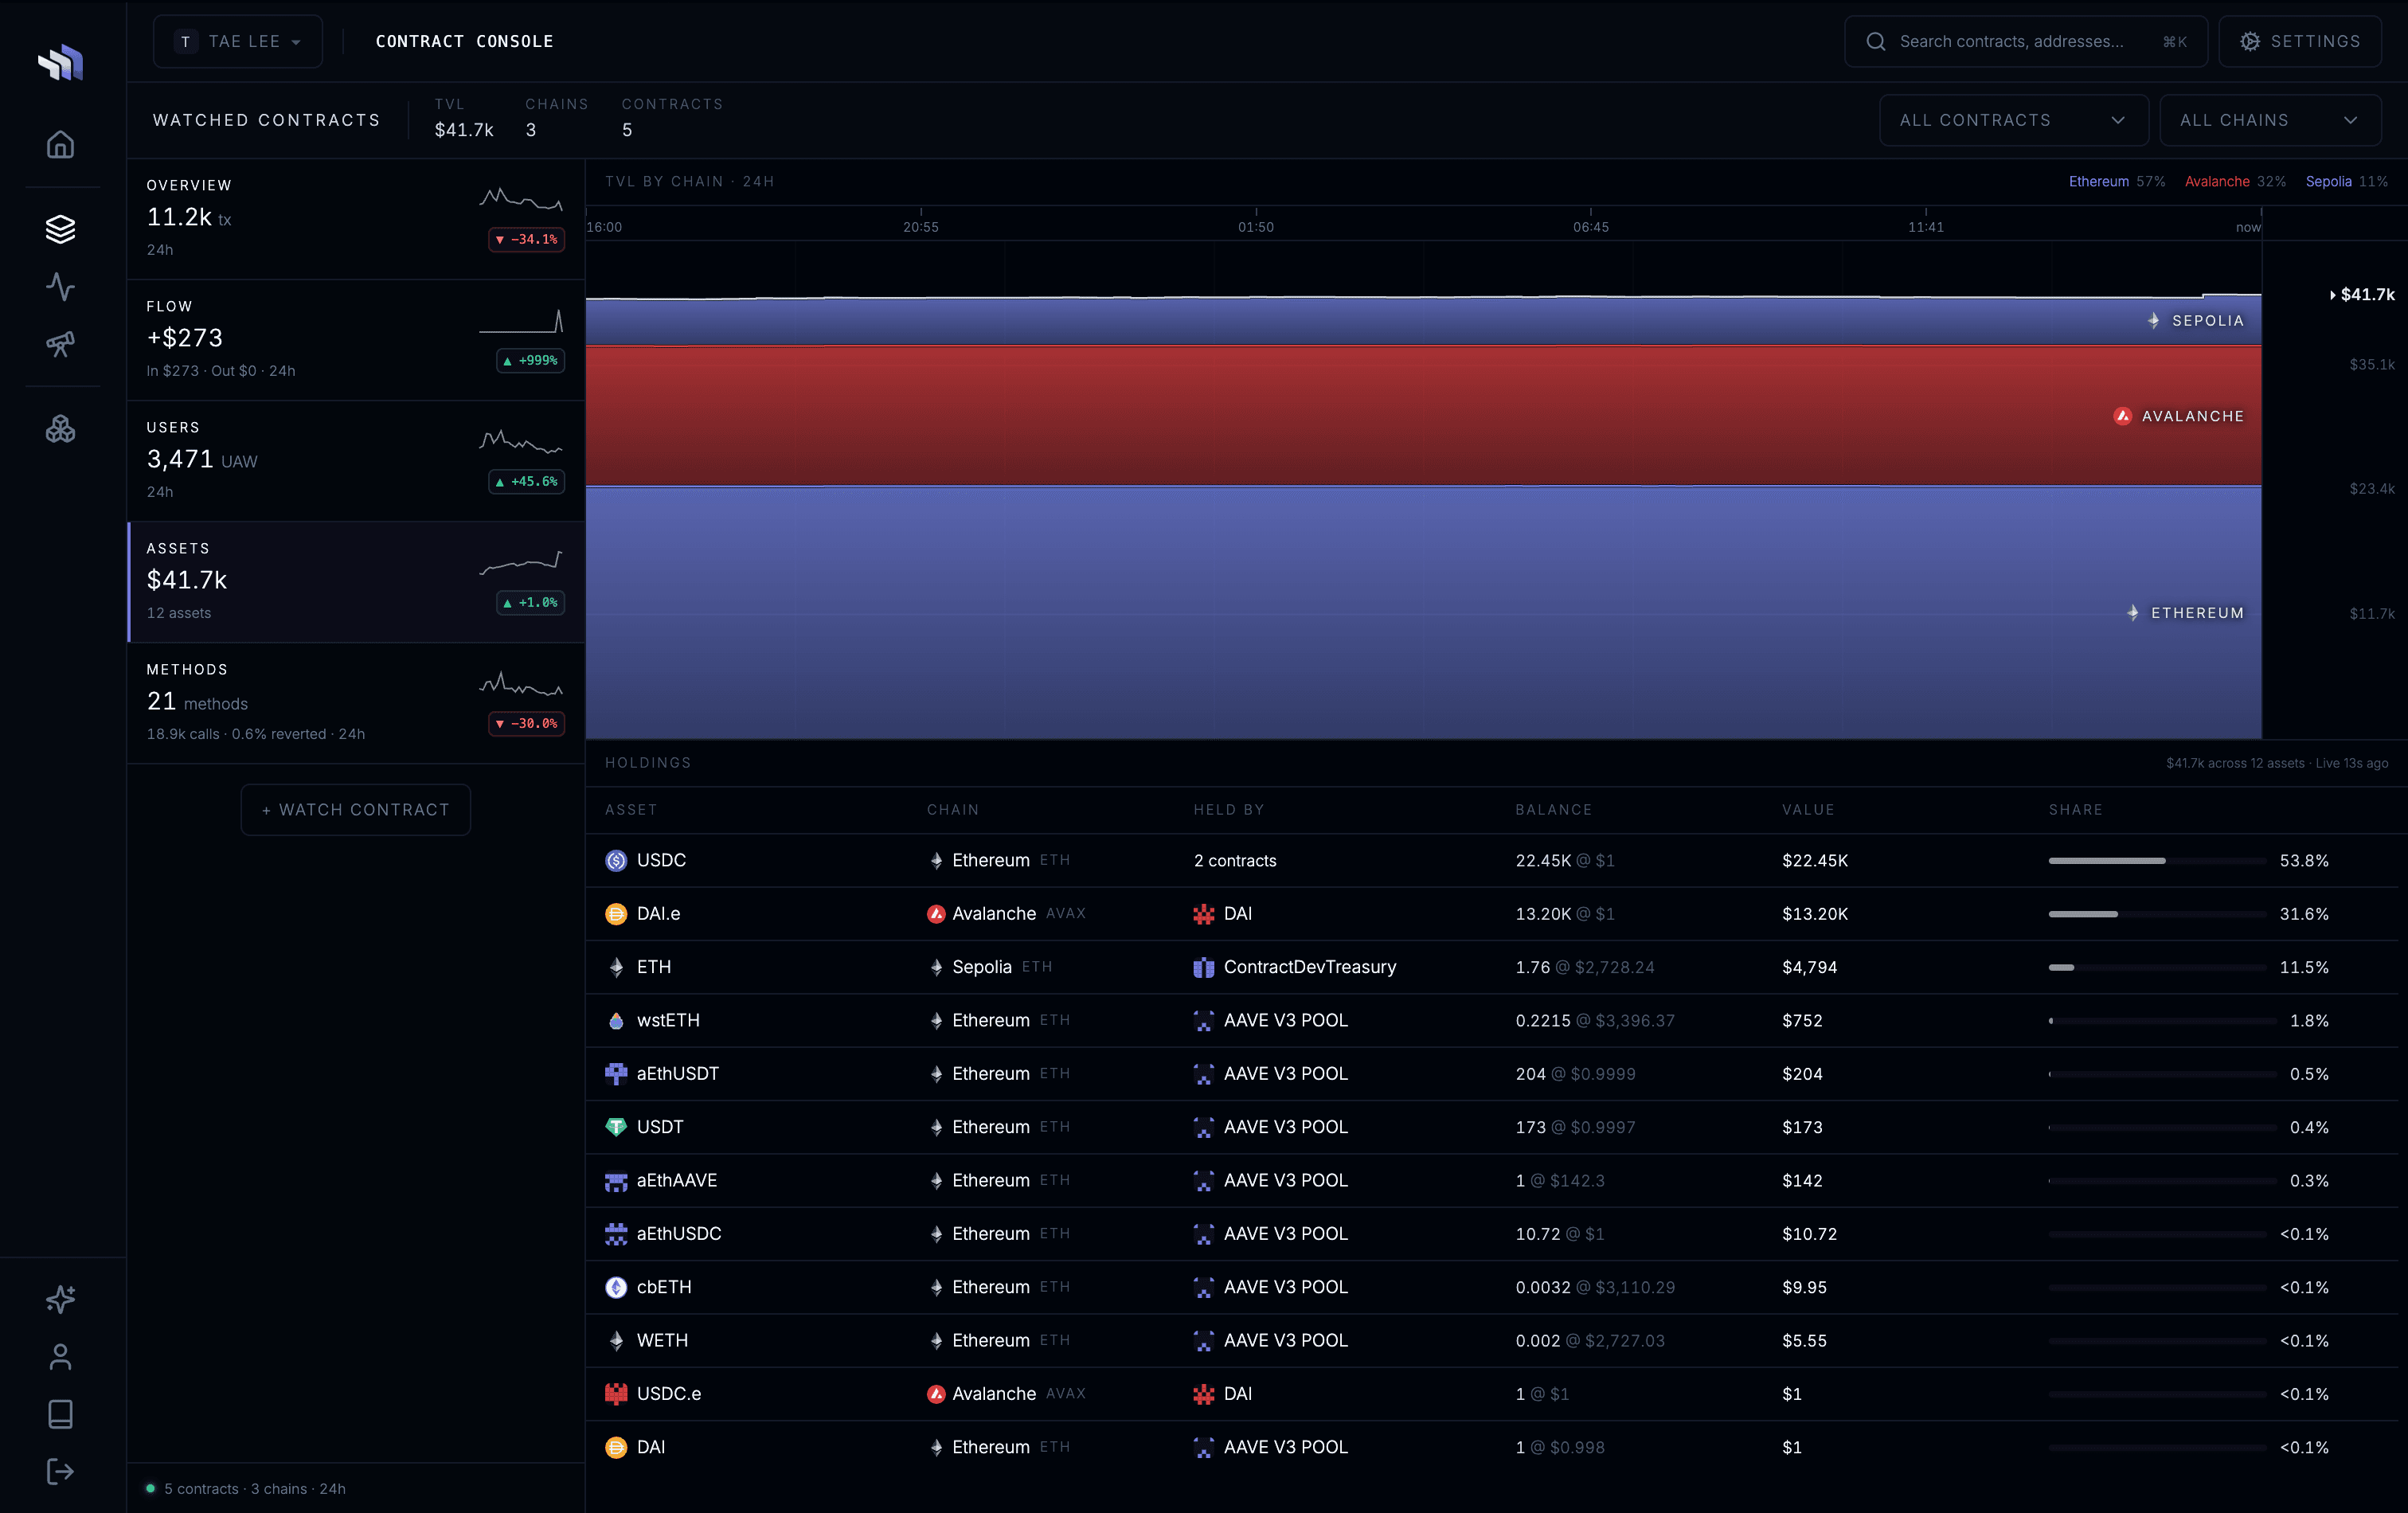
Users is who signed, and how the call arrived: direct, through another contract, or through a door. A door is an intermediary such as a router or aggregator. Assets is TVL over the range, split by chain, and current holdings by token. Flow is inflows, outflows and net, by counterparty and token. Methods is calls, reverts, callers and gas per method. A method’s telemetry can be tracked as a metric from that view.
Activity
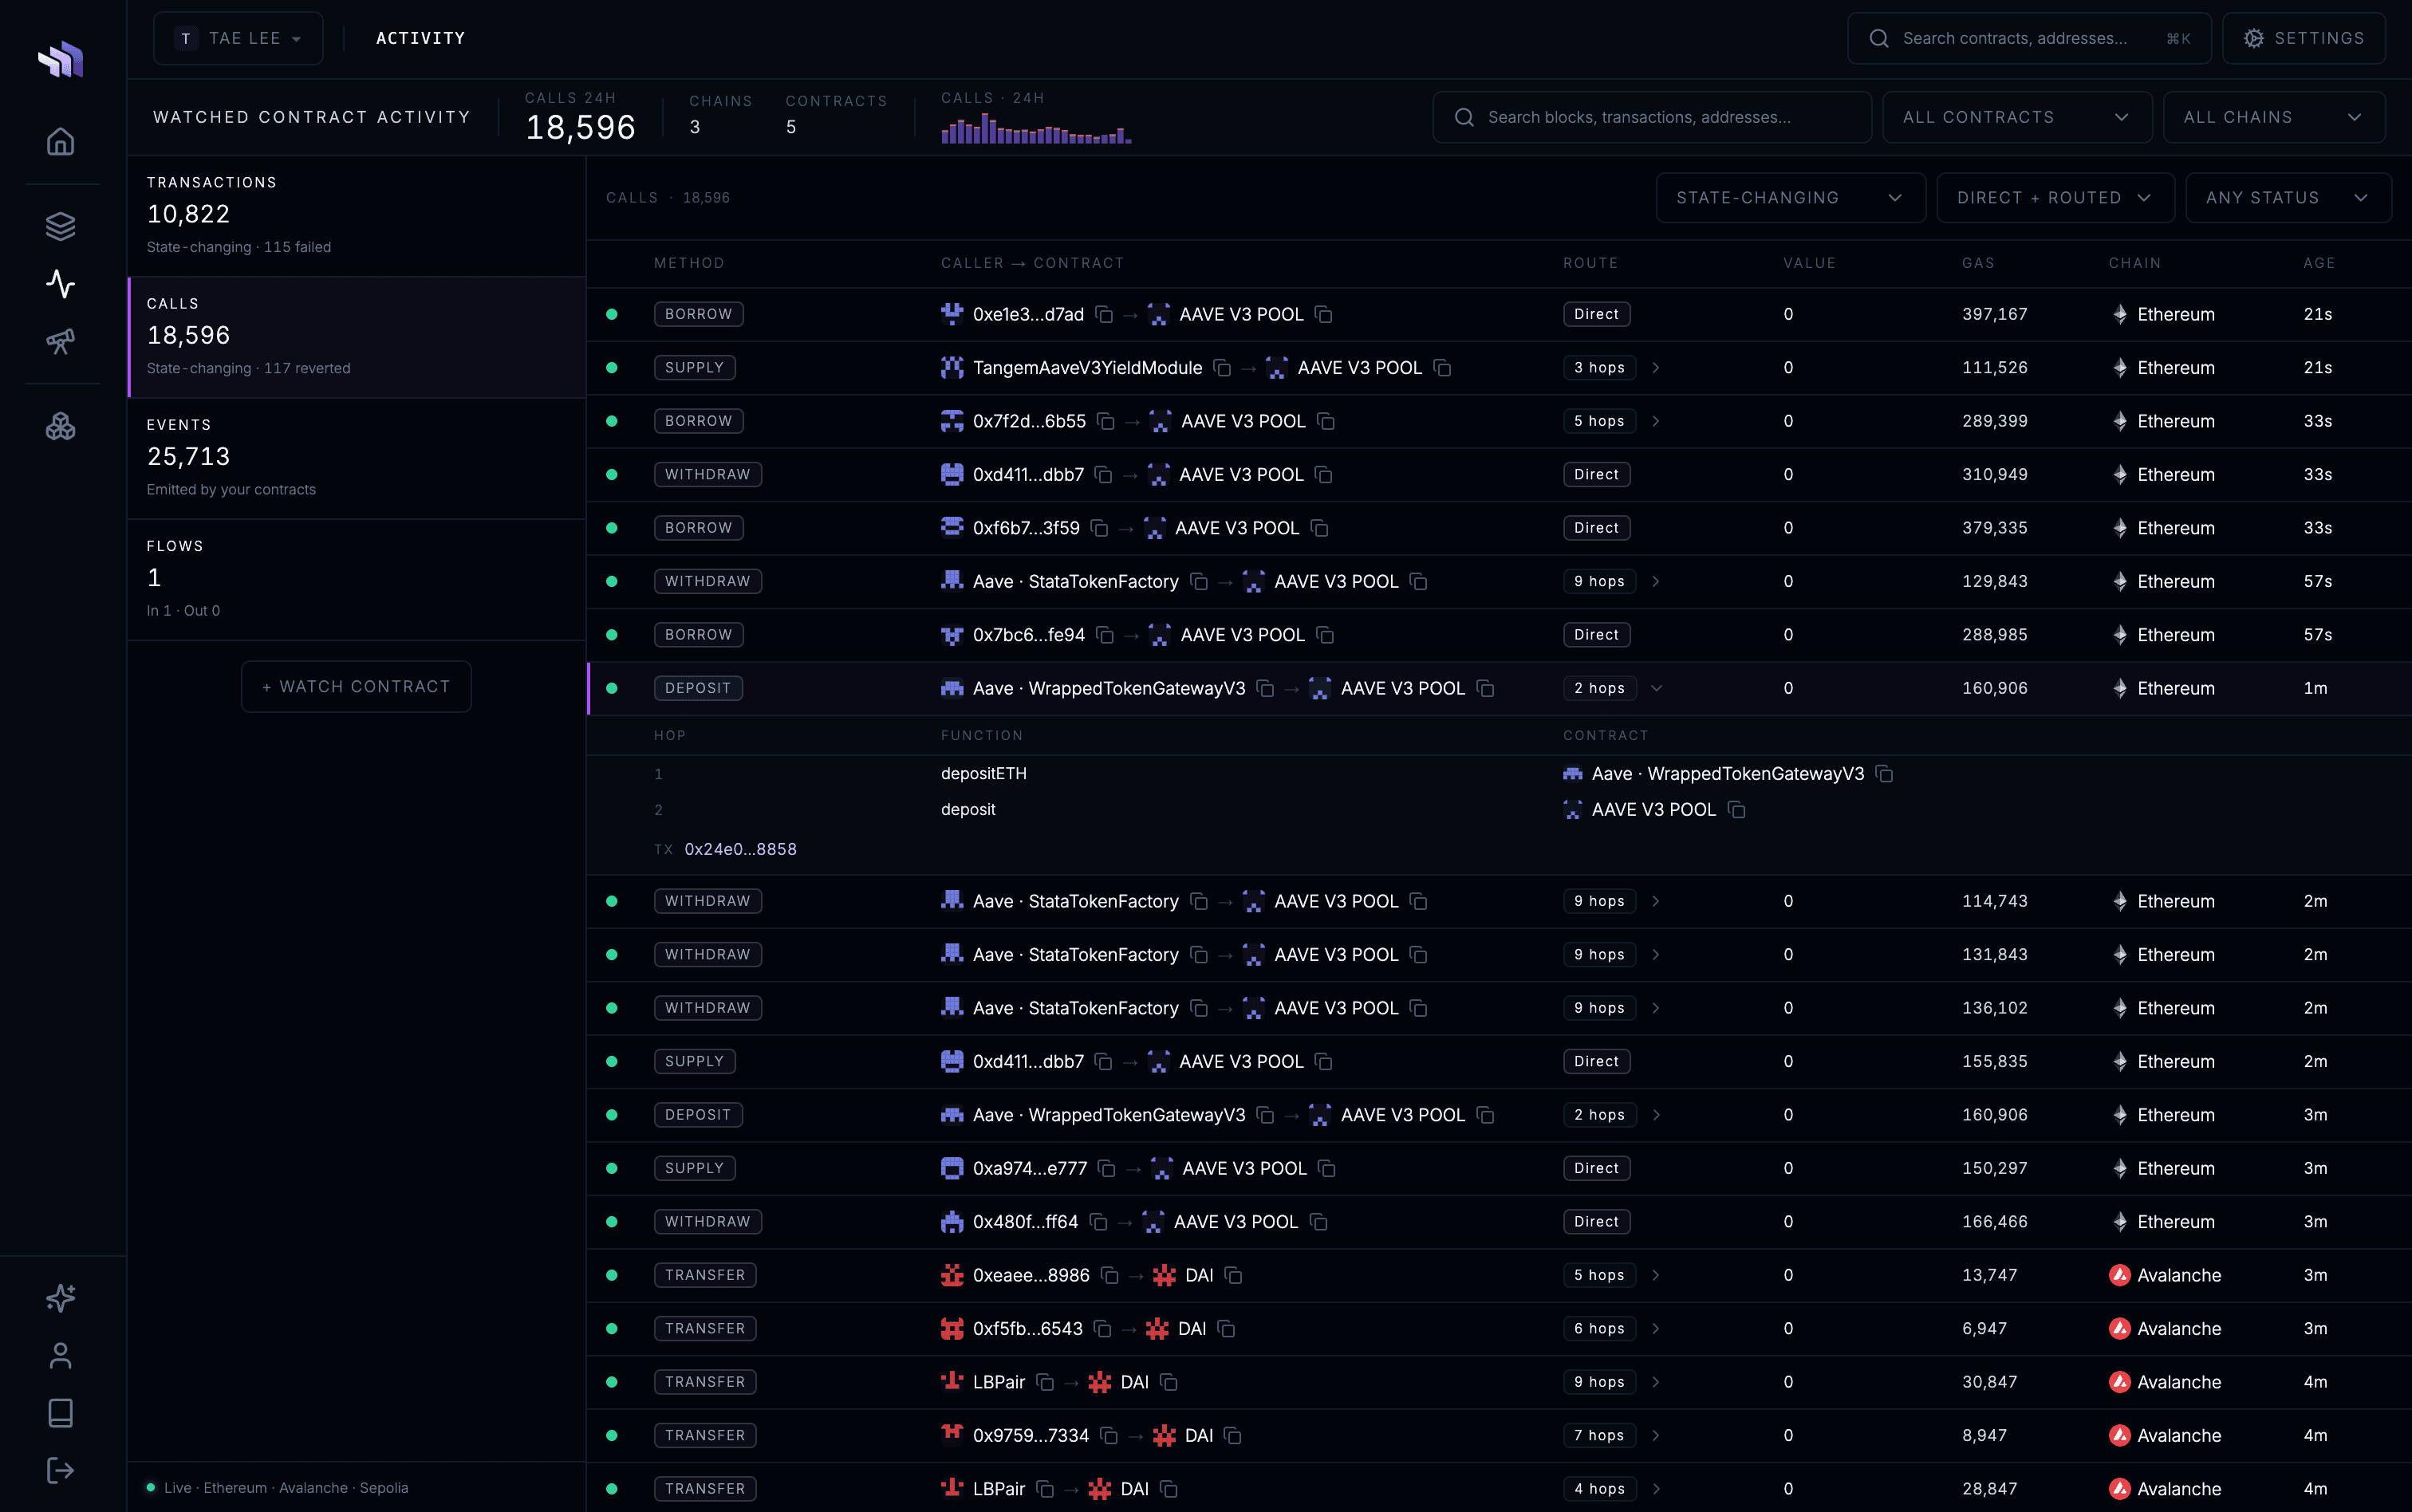
Activity is a feed of rows that involve a watched contract. Calls made through other contracts are included, and so are events the contract emitted. Four tabs: Transactions, Calls, Events, Flows. Chain and contract filter every tab. Filters are in the URL.
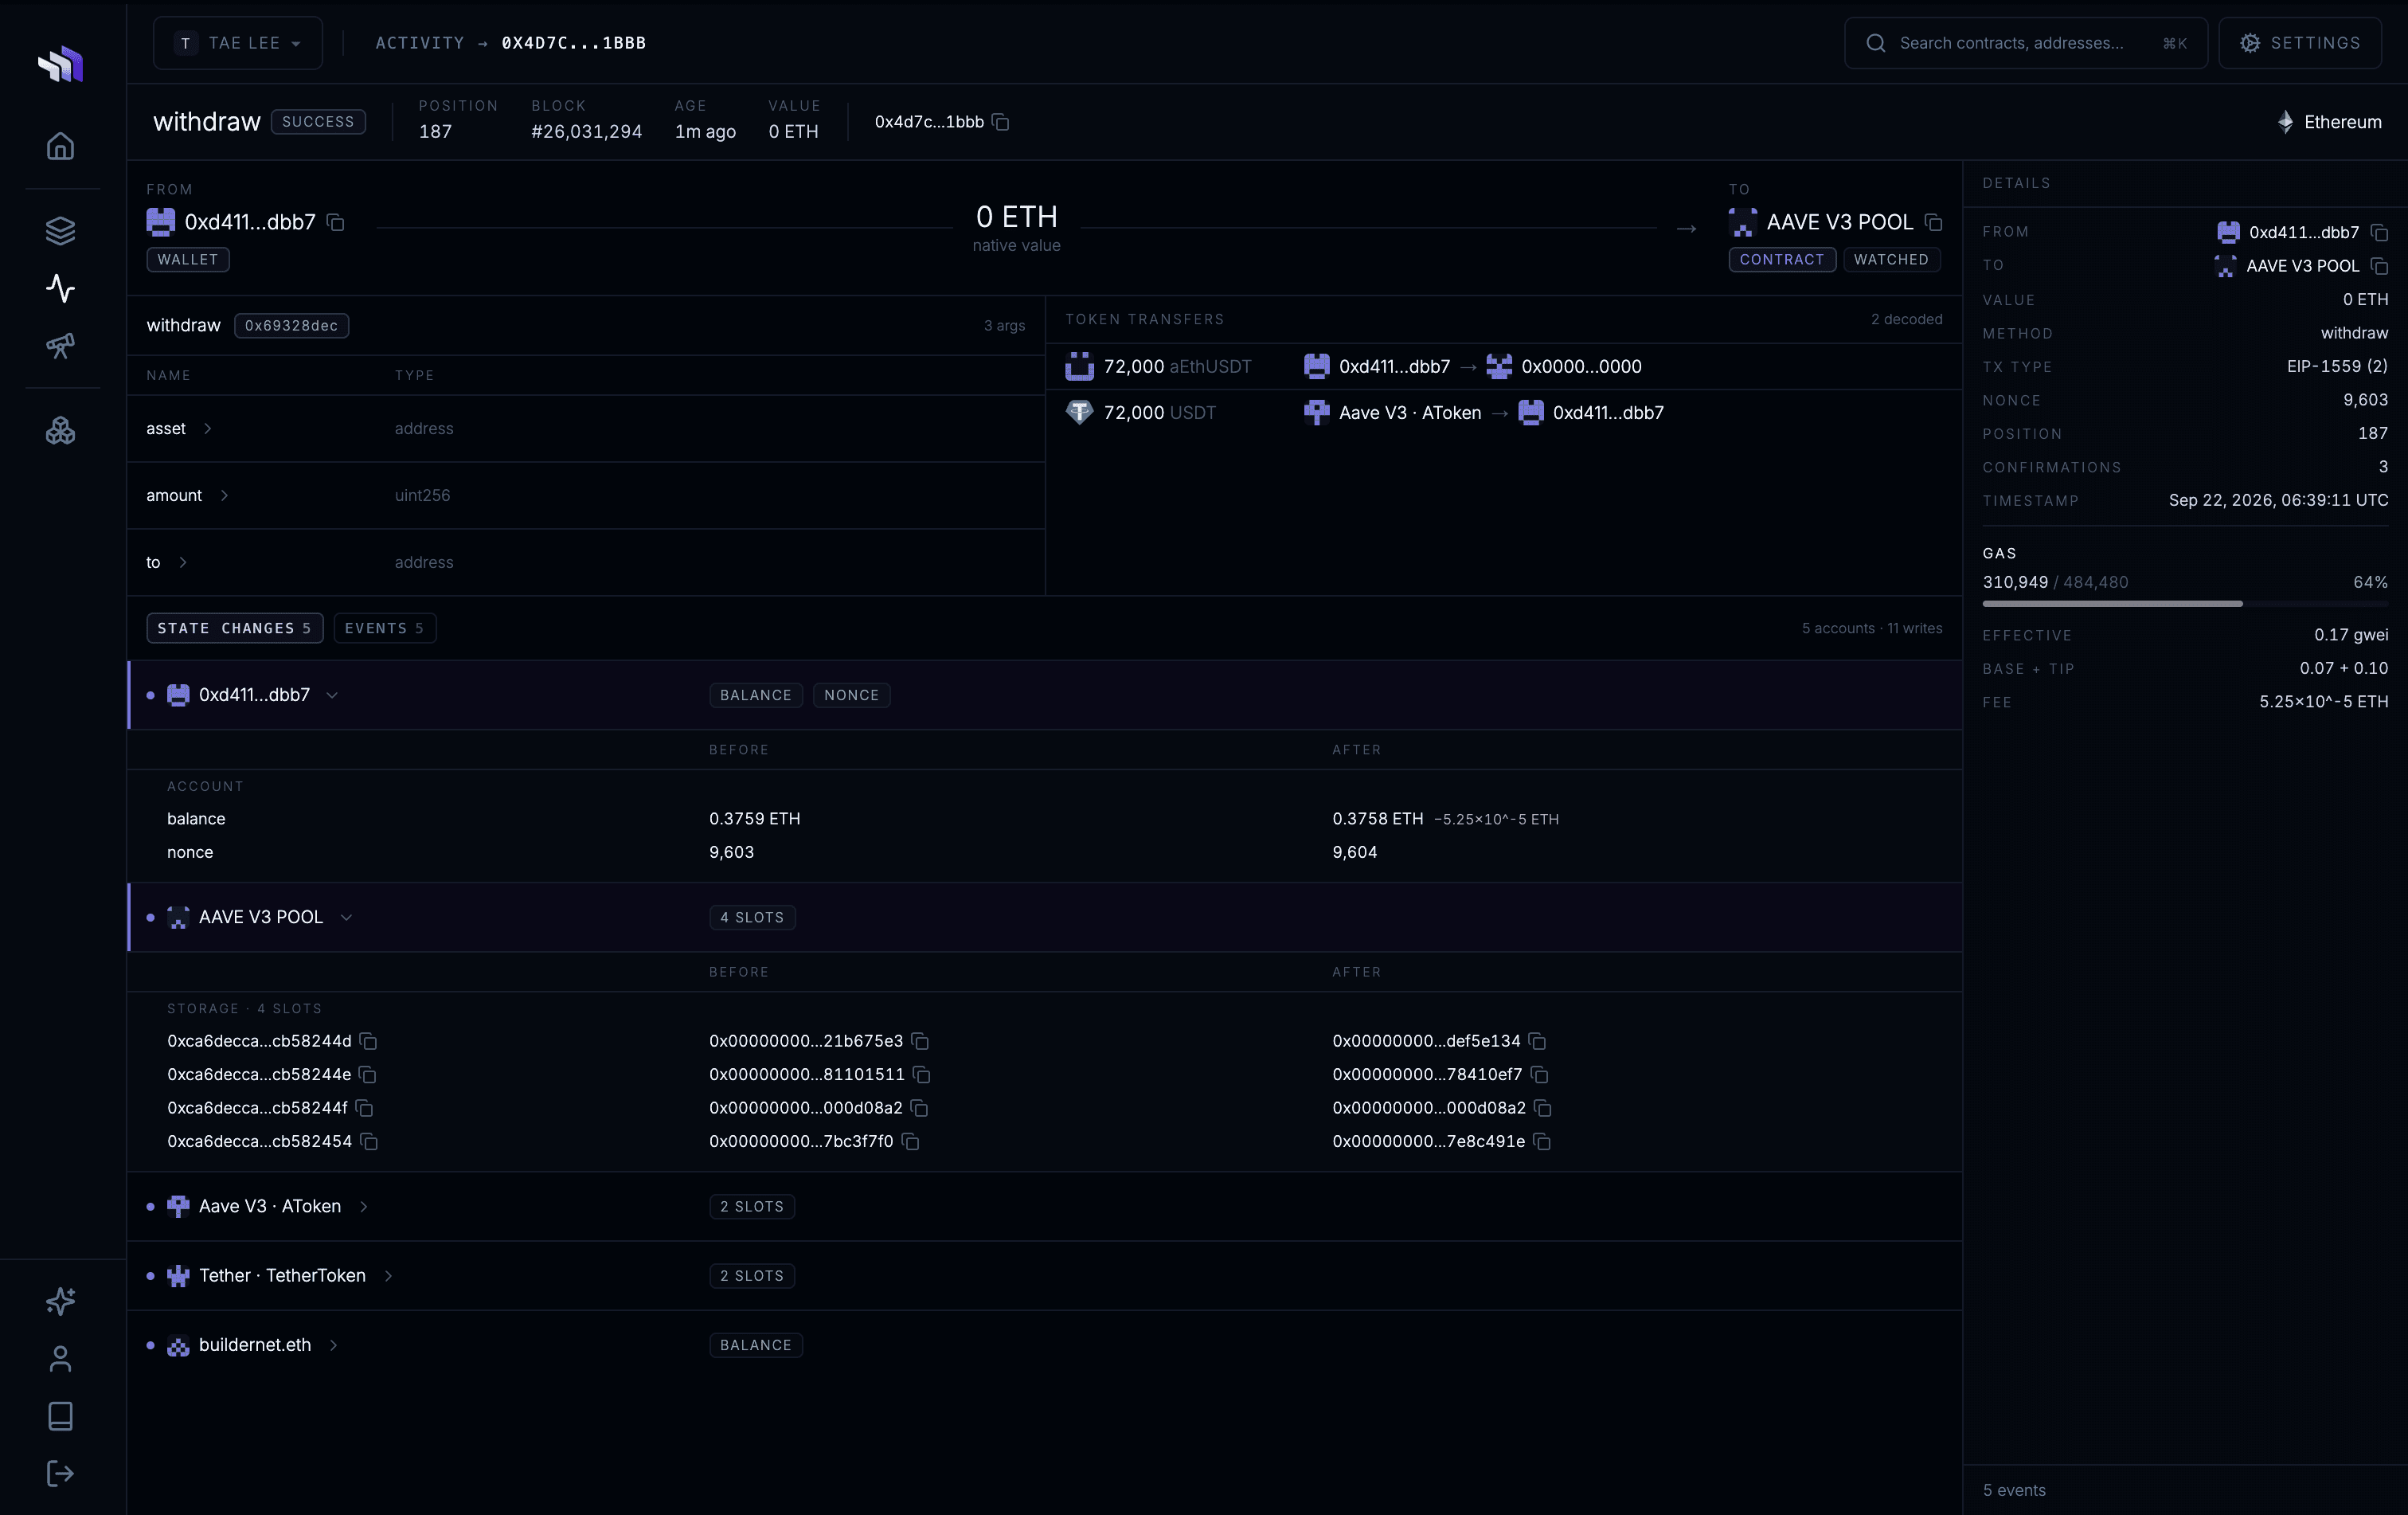
Opening a transaction shows the decoded call and its arguments, token transfers, events, and state changes by address. When an alert episode or a metric reading names a transaction, it links here.
Metrics and monitors
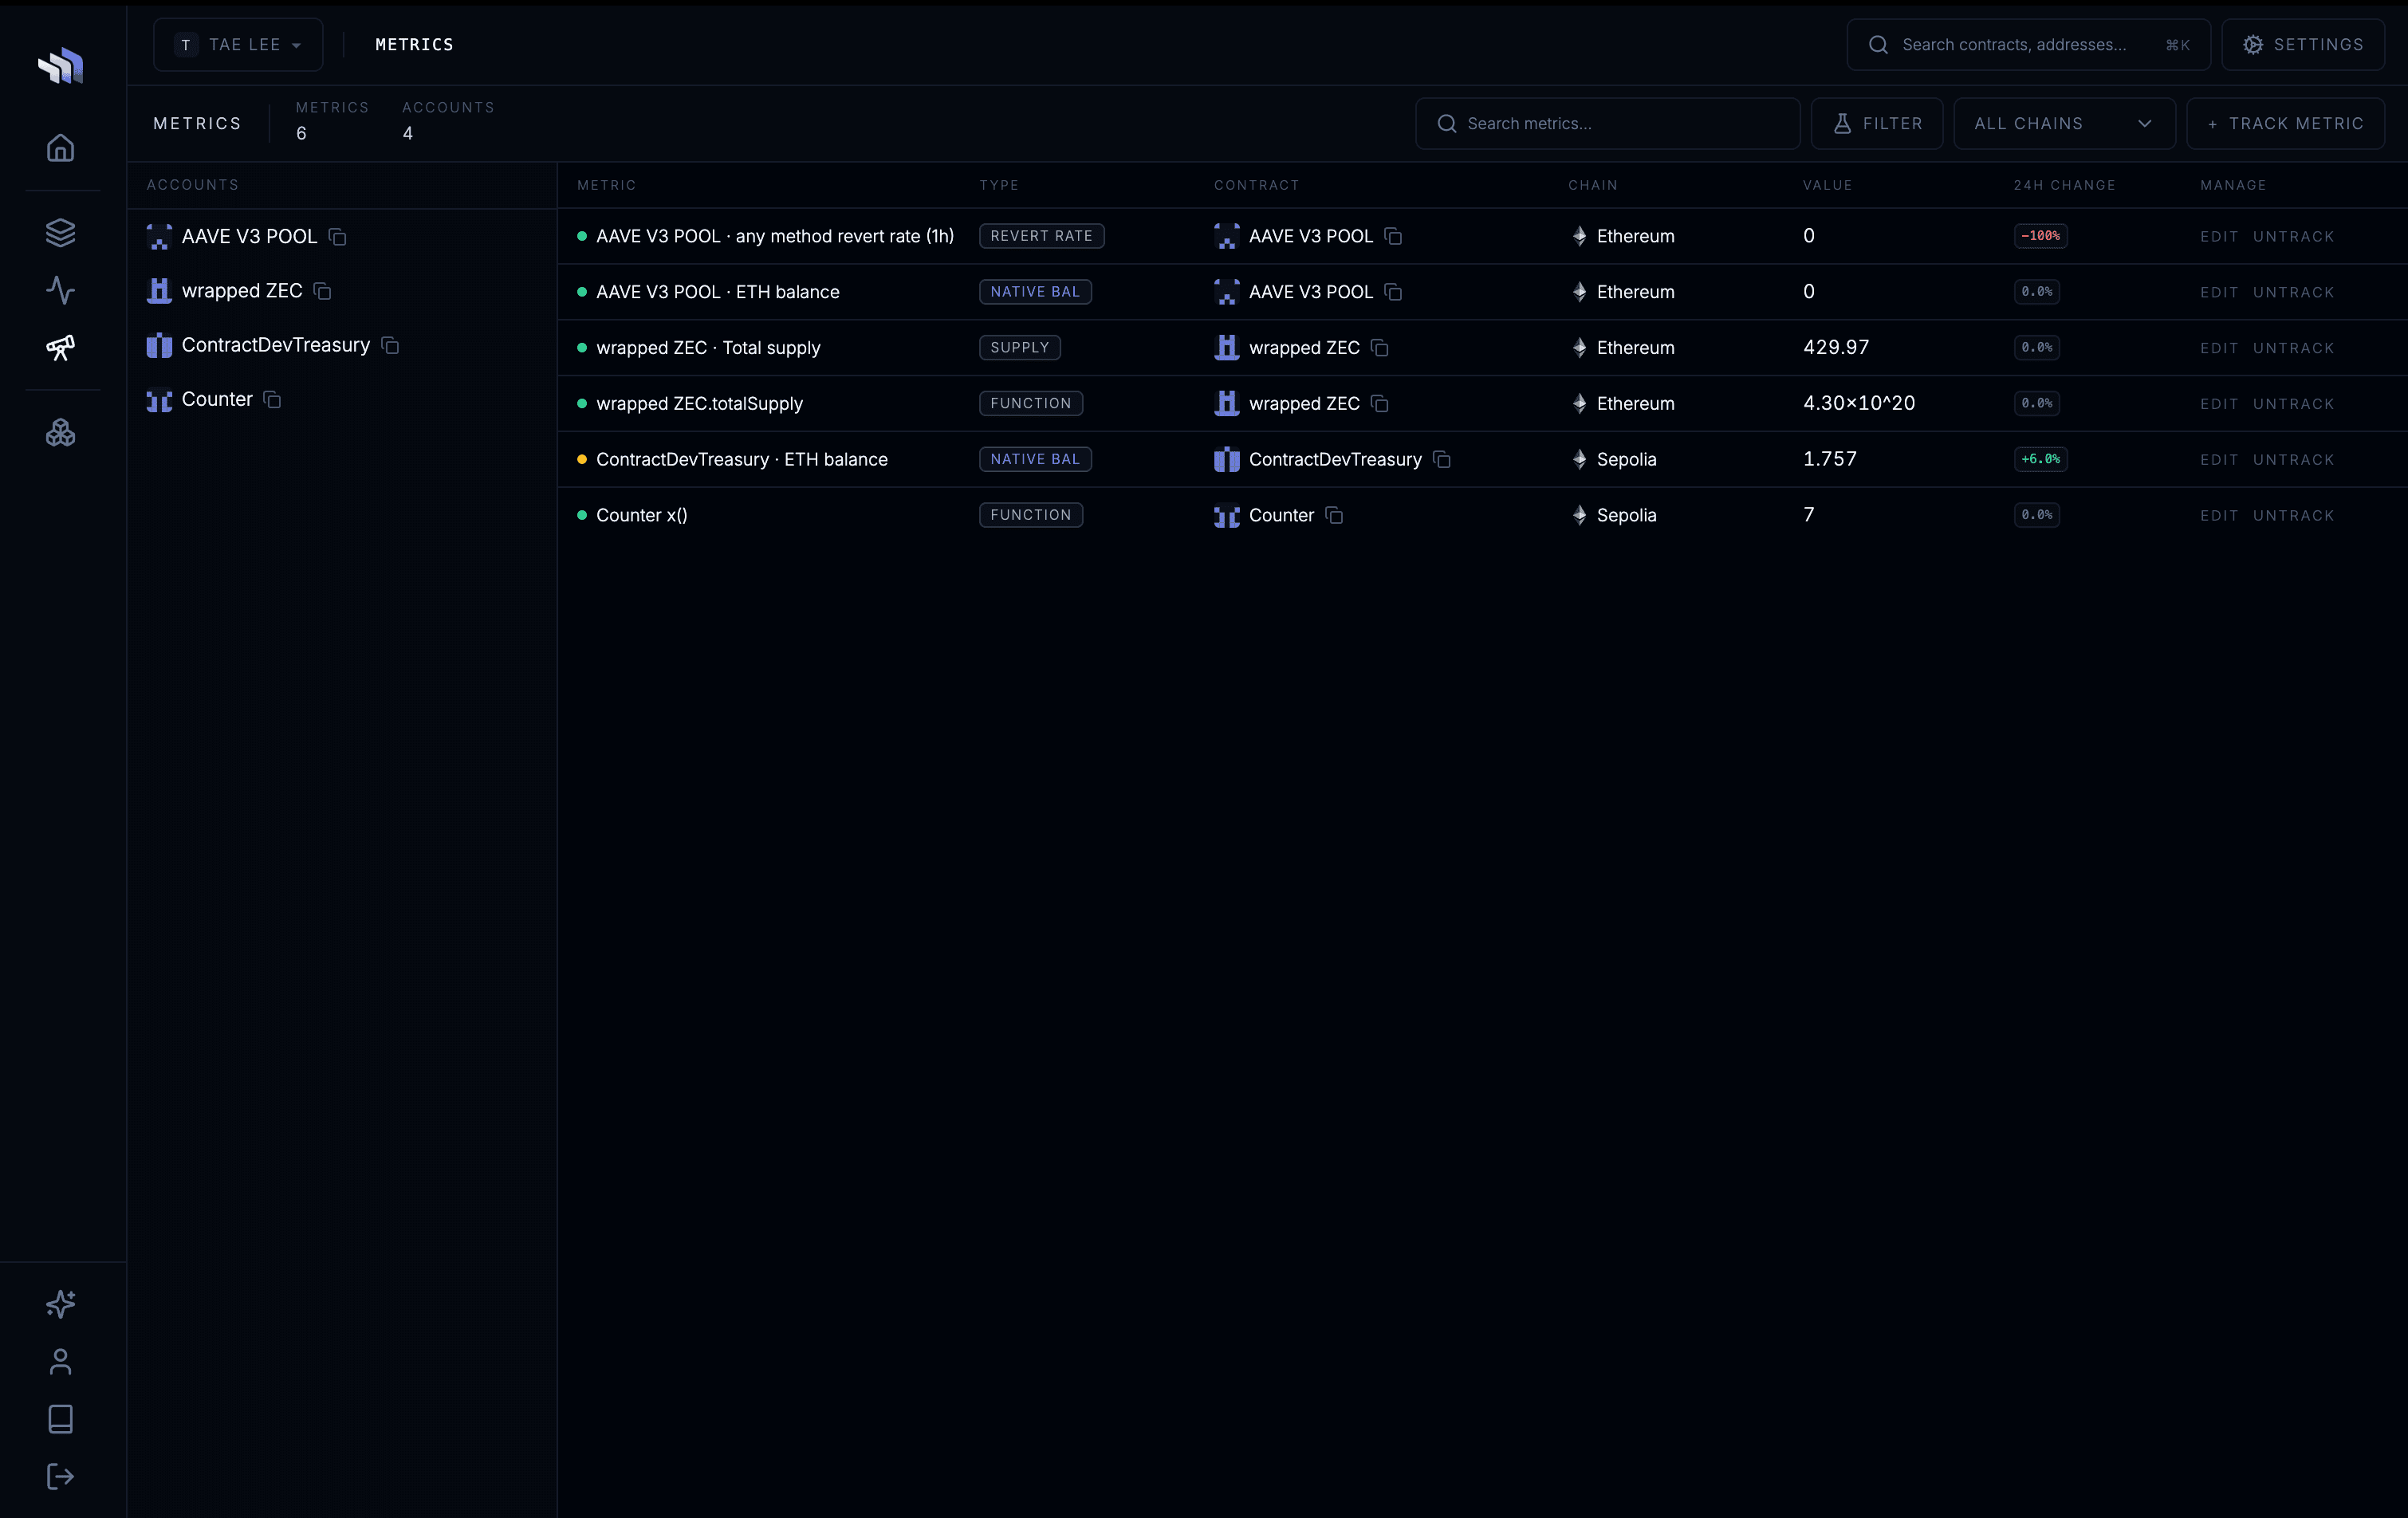
A metric is an on-chain value recorded over time: a view-function result, a native or token balance, total supply, TVL, or method telemetry. Method telemetry is calls, reverts, revert rate, distinct callers, or p95 gas, over a trailing window from 5 minutes to 24 hours. Any address can be tracked. Watching is only required for the dashboards. Each reading keeps the transaction behind the change, where there is one.
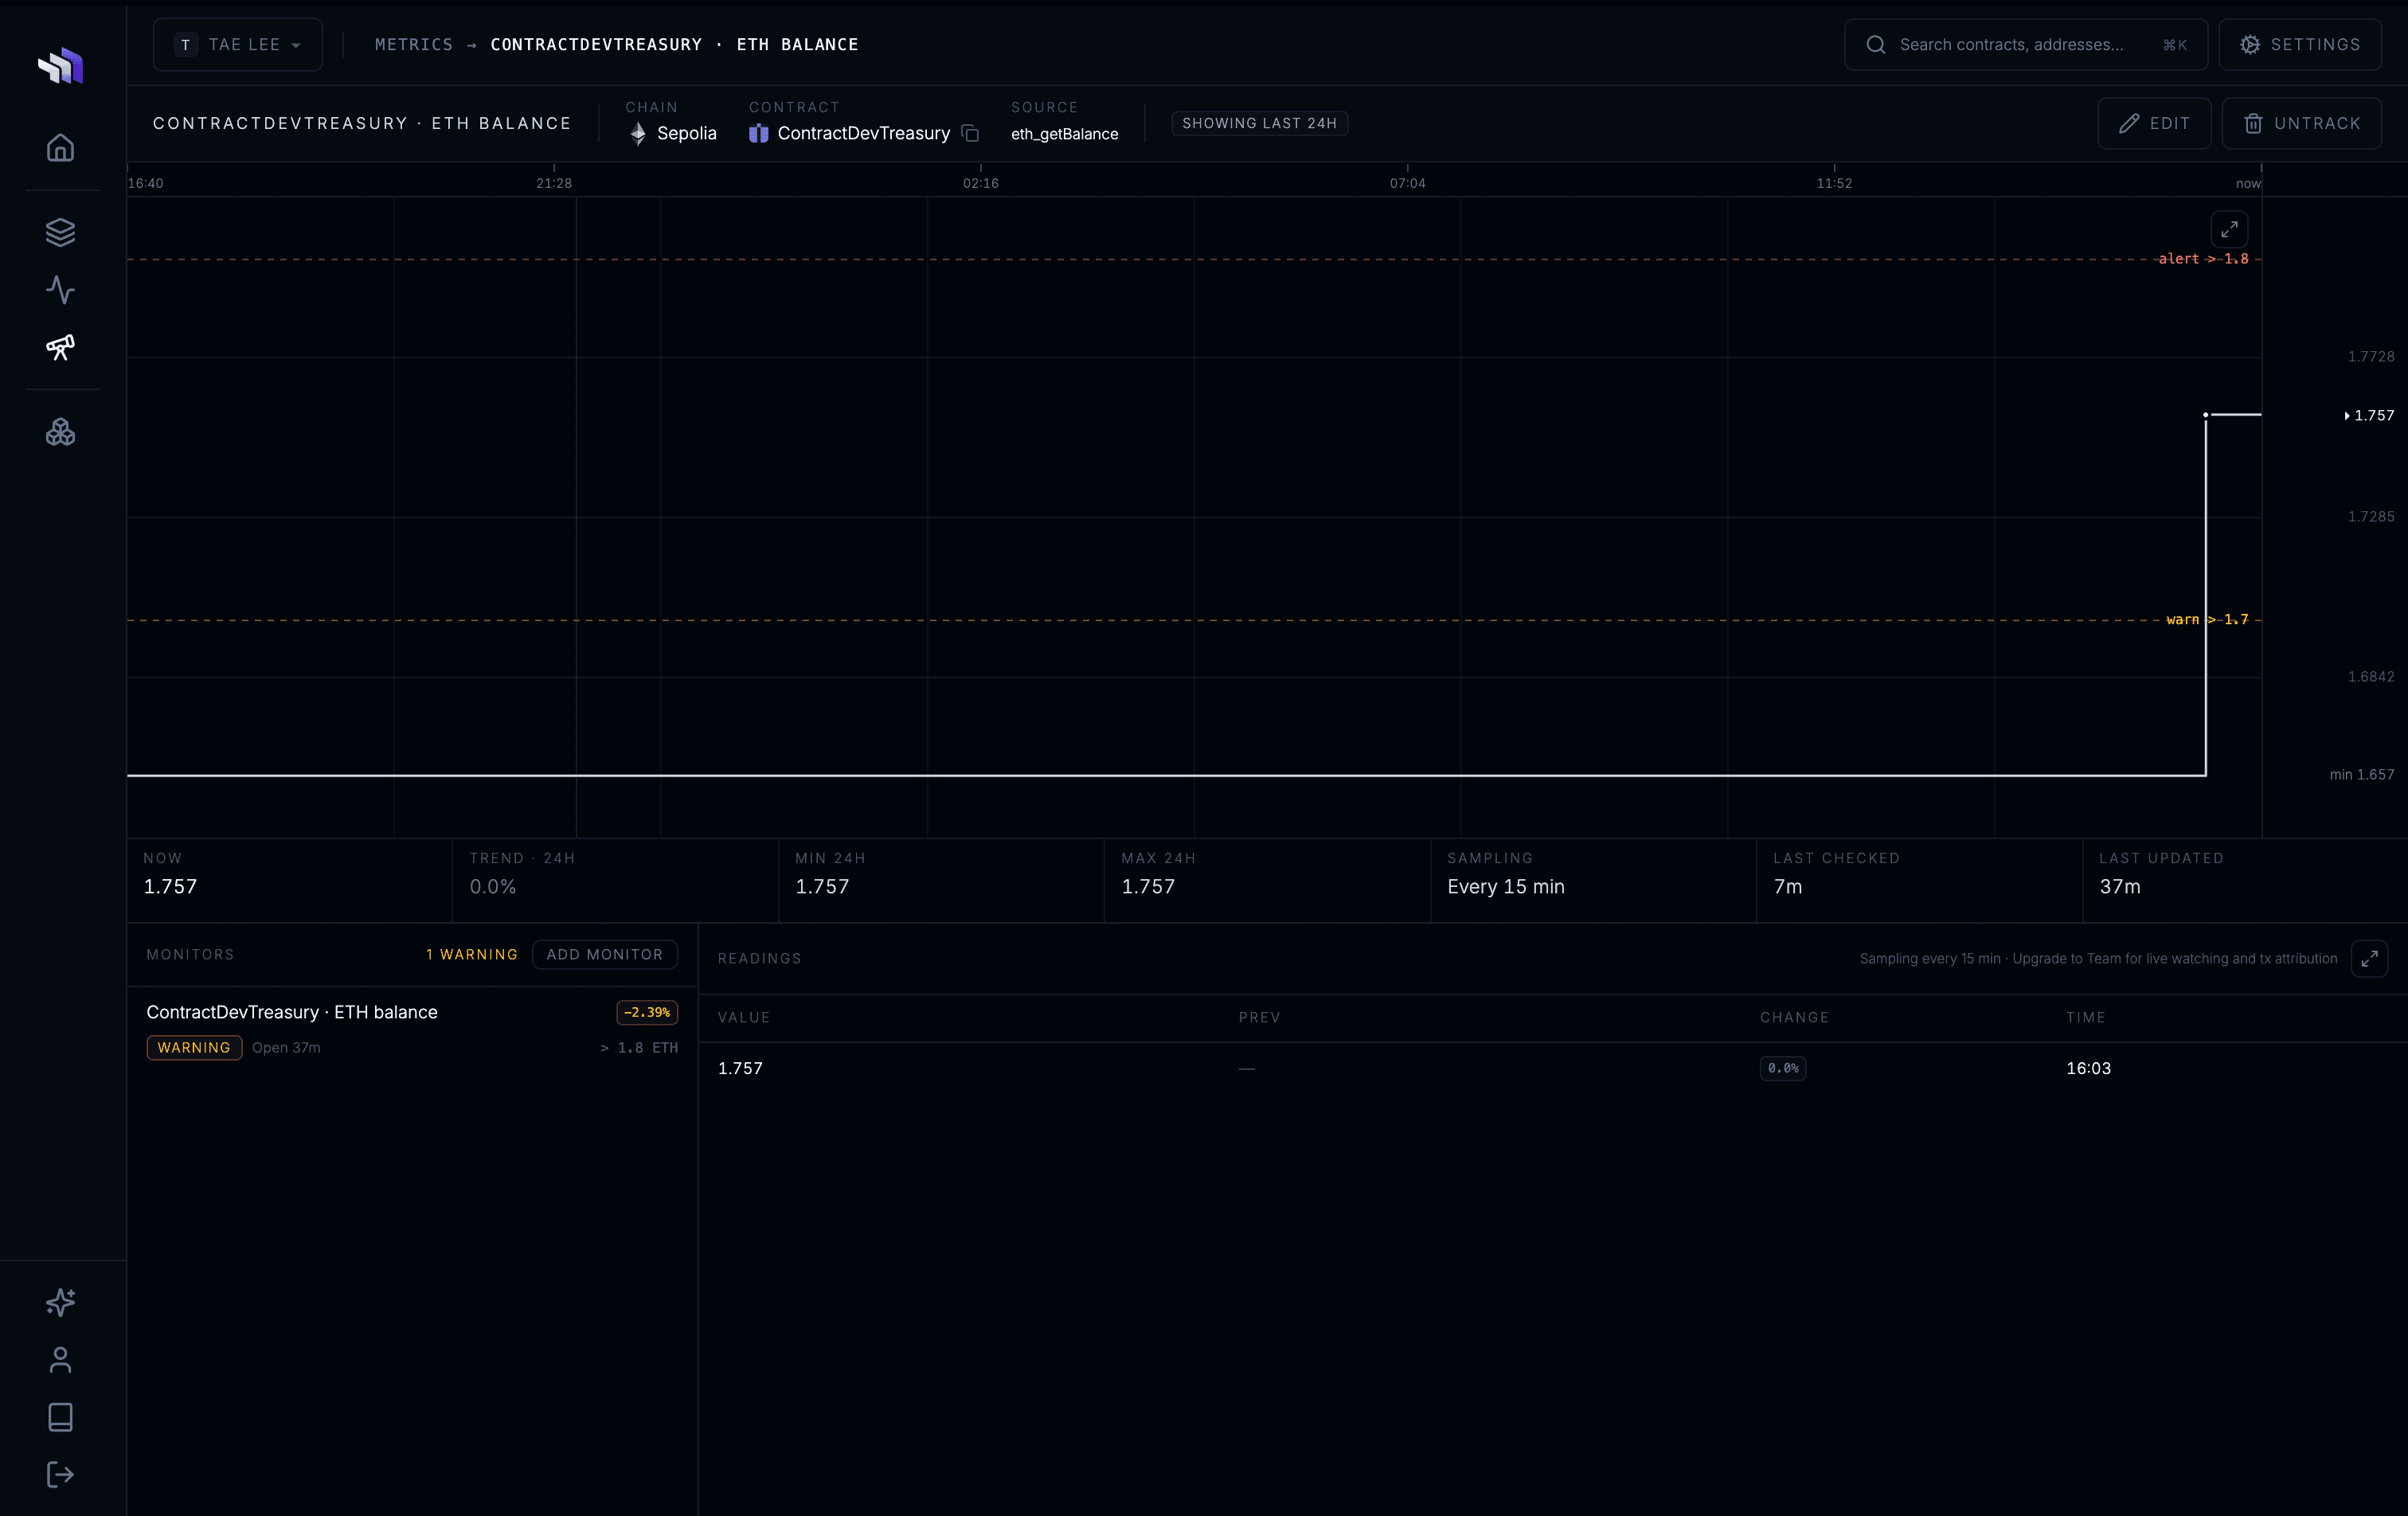
A monitor is a rule on a metric. It alerts when the value falls below or rises above a number, or when it does the same against another metric. An optional warning threshold sits on the healthy side of the alert. Warning and alerting come from the reading. There is no severity setting. A failed rule opens an alert episode, from the crossing until the value recovers, and sends a notification to Telegram, Slack, Discord or a webhook. The metric chart draws the warning and alert lines.
Stagenets
A Stagenet is a private EVM testnet that replays a real chain, so it has that chain’s contracts, liquidity, prices and accounts. Mainnet Replay keeps it in sync with the chain and preserves state written by your own transactions. From an alert episode you can re-run that transaction against this state, test a fix, or stage an upgrade before mainnet.
Each Stagenet has an RPC endpoint, an explorer, a dashboard per contract, a faucet, impersonation, and state and function overrides. Hardhat and Foundry talk to it as a normal chain. Stagenets currently replay Ethereum, Base, Optimism, Arbitrum, Polygon, Avalanche, BNB Smart Chain and Monad.
A CLI agents can drive
The platform can be driven from a CLI as well as the UI. I co-built it with the backend engineer, designed for coding agents as much as for people: watching contracts, tracking metrics, managing monitors, targeting stagenets — with structured output an agent can act on. Designing software an agent can operate turned out to be the same discipline as designing for people: deterministic commands, predictable output, docs that answer the next question.
An outbound engine run by agents
The company’s outbound runs on that CLI as an agent-operated system: a markdown CRM and an operating manual that coding agents execute. An agent researches a prospect’s protocol, sets up a demo workspace through the CLI, and renders a per-lead PDF report on what it found, with parallel subagents doing the sourcing and triage. 7,800+ prospects triaged, 110+ leads taken from first look to a ready-to-send report.
Stack
- Next.js
- TypeScript
- Tailwind CSS
- Prisma
More projects